WhopkinsNHP
Non human primate studies with WHopkins
MRI-based Quantification of Non-human Primate Populations
An external archive for recent results.
Supplemental Figures and Analysis for "Regional and Hemispheric Variation in Cortical Thickness in Chimpanzees"
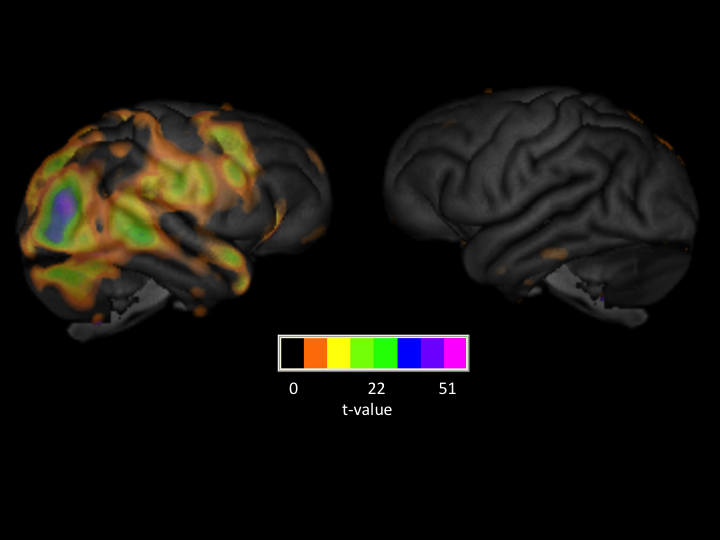 Figure 1. 3D rendering of left and right surface areas and color projection of differences in cortical thickness as measured by voxel-based morphometry. Left-right mirrored volumes images were subtracted from the grey matter thickness volumes in their normal orientation. A whole brain, voxel-by-voxel t-test analysis was then performed on the difference volumes. The difference volume was thresholded at t = 4.00, p < .001; thus, all colors reflect t-values that exceed 4.0. Variation in color intensity reflects the absolute t-value.
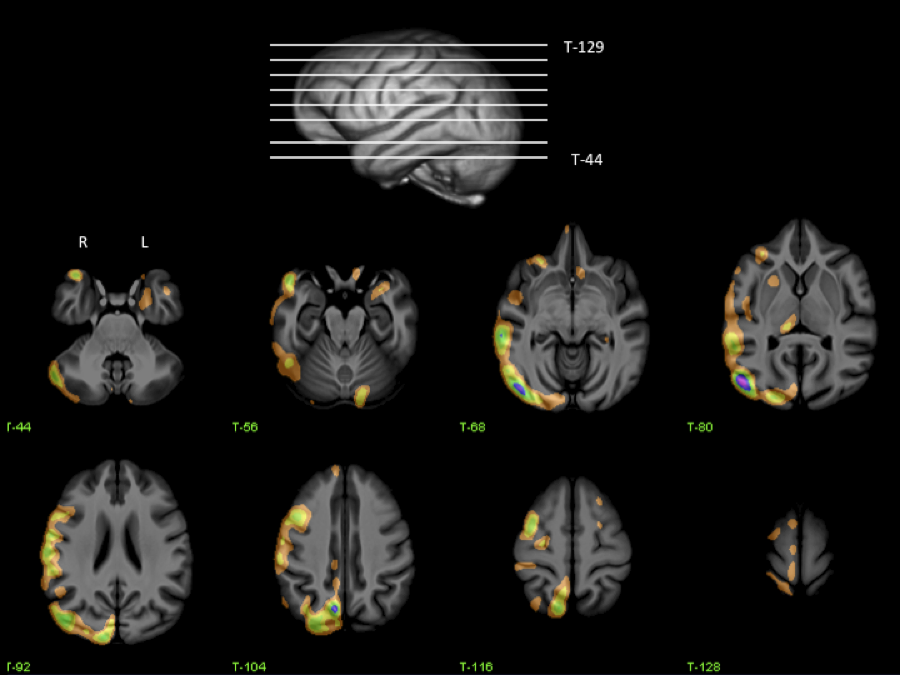 Figure 2: Eight transverse views of the difference volume and associated t-values at different levels along the dorsal-ventral plane of the cortex. Color intensities reflect the absolute t-values (see Figure 1 captions for description).
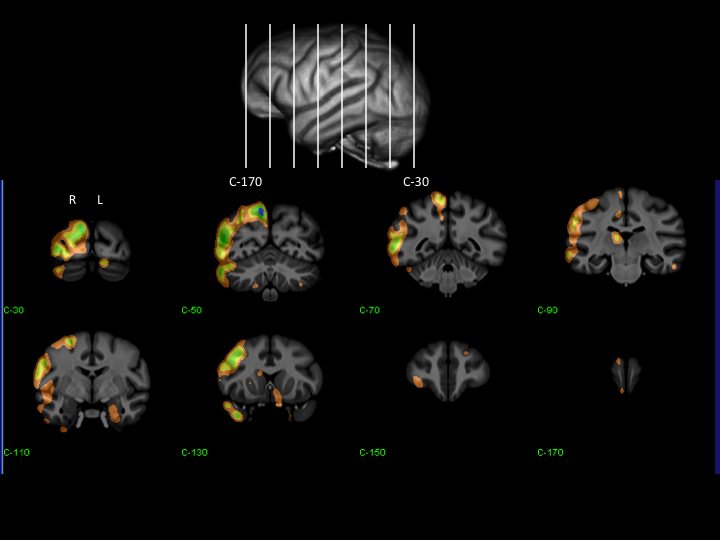 Figure 3: Eight coronal views of the difference volume and associated t-values at different points along the anterior-posterior axis. Color intensities reflect the absolute t-values (see Figure 1 captions for description).
Authors and Contributors
Brian B. Avants ( UPenn ) and William Hopkins ( Georgia State University , http://neuroscience.gsu.edu/13890.html )